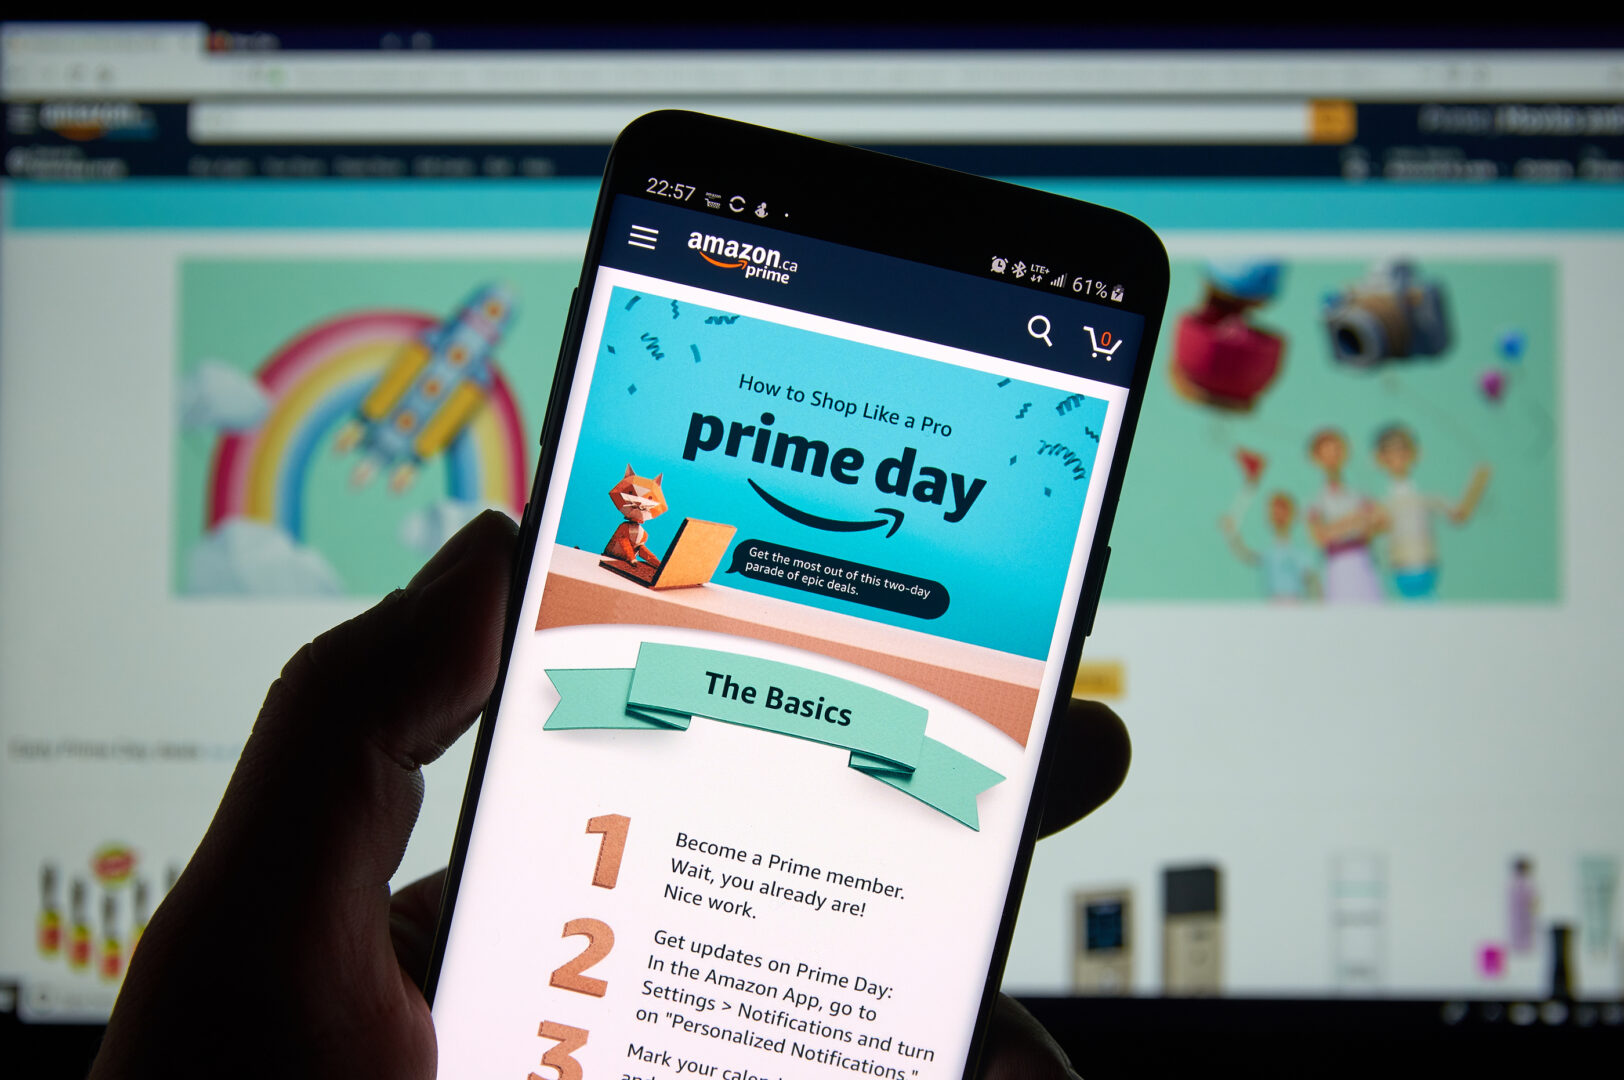
Data is gold to any business, but especially ecommerce-driven companies. Depending on where you sit in an organization, that data can mean different things. For a marketer, return on ad spend (ROAS) is the only metric that matters, while fulfillment may be more focused on stock and product arrival times. The full value of your ecommerce data analytics lies in the big picture — both the selling and moving of stuff (and everywhere in between). With a holistic view that goes beyond vanity metrics, businesses can drive sales and increase their marketplace performance. It’s this one-two punch that separates companies positioned for long-term growth from those focused on short-term wins.
Knowing where to start is the hardest part of realizing the full benefits from your ecommerce data. We’ve outlined the major steps below with some useful advice about which metrics to pay close attention to. The good news is you don’t need a Master’s in data science to optimize your data resources. With the right data partner, you can add significant expertise and insights to your team immediately for bottom-line impact.
Consumer and marketplace fragmentation makes accessing your ecommerce data a major headache for brands. Gathering and analyzing sales data across channels is not only time-consuming but also resource-intensive. Without the technical chops and data scientist bench, it’s no wonder many brands rely on the more “comfortable” and familiar siloed metrics to inform business decisions.
However, omnichannel ecommerce data is the lynchpin to both your short- and long-term success. In an increasingly complex market, competition will only intensify, so investing in your data as the most valuable resource you have is well worth it.
Collecting data is clearly important, but how do you go about doing that in smart, strategic ways? There are two options for data collection: aggregation and warehousing. The first focuses on centralizing all of your ecommerce data across channels in one place. Keep in mind each channel may provide different metrics that aren’t necessarily an apples-to-apples comparison so some heavy manual cleanup may be necessary. Also, aggregation enforces a time limit on your data. Although it’s helpful to see how a specific campaign performed in isolation, it’s even more useful to compare that campaign month-over-month, year-over-year or even season-to-season. This is where aggregation alone falls short.
By contrast, warehousing takes aggregation one step further by storing and centralizing ecommerce data in perpetuity. Now your lookback window is wide open. For example, today, you can see your Amazon sales analytics for the last two years, but you can’t pull search-term data older than two months. If you want to see trends related to seasonality or even what consumers searched for last year, you can’t do this without a warehousing data partner. This kind of data storage helps brands more accurately track performance and predict future trends across all your channels by comparing historical data quickly and easily.
Ecommerce data analytics extends beyond sales data to marketplace performance. There are three important factors that define marketplace performance:
Combined, these factors enable a brand to understand how its overall goals align with a specific marketplace’s performance. Marketplace reach is commonly overlooked, to a brand’s detriment. For example, a brand may make less money selling its products on Amazon. But in reality, the customers acquired on Amazon may never shop anywhere else.
Play the long game to maximize sales by investing in an omnichannel approach. Like personal investing, diversification hedges your bets. Some customers only shop on a particular channel such as Target or Walmart. You may make more money on your own branded site, but you’ll lose out on the scale and reach of channels like Amazon. Use the three factors above to weigh the opportunity cost of sacrificing lower profitability for the sake of reaching a particular segment of customers only found on a given marketplace.
Monitoring marketplace performance can also provide critical insights into competitors. Brands lack reliable share-of-market data today, especially on the product level. But with an experienced partner to guide you, brands can grasp how large the market is and where you stand in relation to competitors. This intel will help create performance benchmarks for true comparisons. Marketplace data can confirm if your strategy is actually moving the needle and how to do more of what’s working (and less of what’s not).
The use cases for your ecommerce data are endless. Here are three real-world examples of ecommerce data driving Amazon Marketing Services performance in advertising, sales, and share of voice.
Example: Advertising
At WBX Commerce, we often partner with brands that outsource sales to an ad agency. What we’ve found is that most brands live and die by Return on Ad Spend or ROAS, but there’s a lot of overlooked nuance in that metric. In one case, an ad agency spent 90% of the brand’s budget running ads targeted to consumers already searching for the brand’s name. Naturally, ROAS was high because intent was already high. The brand didn’t acquire new customers through these initiatives, since those consumers were already in-market and considering the brand. In a related case, the agency failed to provide the brand with insight into how its competitive set fared on search. For example, if Competitor A scoops up traffic for “flavored water” over its brand name, there’s an opportunity to steal some of that share by advertising to that keyword.
Takeaway: Look at consumer search data as part of your advertising strategy — before you spend.
Example: Sales
Advertising can drive significant bumps in sales when ecommerce data takes the wheel. For example, a brand had an extensive list of long-tail ad traffic. Individually, each of these keywords weren’t meaningful, yet in aggregate the volume was valuable. After examining the brand’s product catalog, WBX Commerce identified which products to focus ad spend on. The sweet spot turned out to be search traffic and/or buying those products and the profitability of the channel. Targeting that specific traffic, WBX Commerce realized a 15% – 20% increase in sales for the brand. And, in aggregate, total sales grew as well.
Takeaway: Re-examine keywords individually and holistically across your product catalog to find opportunities to drive sales.
Example: Share of Voice (SOV)
What’s the conversion share of a given search? If you can’t answer that easily, you’re not alone. But this is valuable intel that a trusted data partner can and should provide. For example, let’s say your brand runs ads against “flavored water” and achieves a $5 ROAS. Everyone is happy. But how are your competitors faring against that same traffic? Is your share increasing or decreasing over time? On Amazon, you can see, by keyword, what the top three products clicked on are and what percent of sales each earned. Competitor A had 10% of all clicks and 20% of all conversions last week. This week, they earned 6% of clicks and 14% of conversions. Now compare that share to your own and you’ll start to surface trends to inform not only your ad strategy but your share of market.
Takeaway: Marketplace performance can unlock valuable opportunities to steal competitive share, acquire new customers, and increase advertising effectiveness.
Take the next step in your ecommerce success story. WBX Commerce can help. With our new WBX Insights product, brands get a complete view of marketplace sales and performance to fuel data-driven decisions across all relevant channels. Both aggregation and warehousing affords brands access to all their data in one place. WBX Commerce experts provide real-time insights to power performance, understand customer and product trends, and optimize your revenue potential for marketplace growth. Unlock the full value of your ecommerce data with our leading tech and unmatched talent. Reach out for a demo today.